The Middle Maitland Valley sub-watershed (MMVS), with 74.7 square kilometers of surface area, is an agricultural sub-watershed, located North-West of the Greater Toronto Area (GTA) of Ontario Canada, between latitude 43.685°N and 43.788°N and longitude 80.972°Wand 80.771°W (Figure 4). Listowel is the closest city to the MMVS. Corn, wheat, soybeans, oats, and alfalfa are the major crops grown in the sub-watershed, covering approximately 988 fields. 161 farm houses can be identified from aerial photography. There is a also a large beef and dairy cow population in the area (Census of Agriculture 2011).We recognize that farm consolidation and non-farming rural residential households reduce the actual number of farm units in the sub-watershed, so we approximate the number of farms at 100.
4.1 Data and geo-data based structures
Three sets of data are used to populate the model:
-
- Data from the literature
These data are mainly related to GHGs produced by both conventional and organic farming (Pelletier et al., 2008; Lynch et al., 2011). The ABM needs to estimate GHG emissions from various crops in the two agricultural models. CO2 equivalents (CO2e) are used as a measure and estimated as gram per kilogram of crop production (g/Kg). Sources are presented in table 1.
| Crop | Conventional
Co2e (g/Kg) |
Organic
Co2e (g/Kg) |
Source |
| Corn | 330.10 | 256.30 | Pelletier et al., 2008 |
| Winter Wheat | 382.20 | 290.60 | Pelletier et al., 2008 |
| Soybeans | 247.60 | 190.30 | Pelletier et al., 2008 |
| Oats | 0.12 | 0.07 | West et al., 2002 |
| Alfalfa | 0.003 | 0.003 | Adler et al., 2007 |
Table 1- Default values for CO2e production from conventional and organic farming systems
2. Geo-data and shape file attribute tables
Geo-data and shape files for 5 years (2005 to 2009) were provided by the Maitland Valley Conservation Authority (MVCA). These 5 years of data and their attributes were joined to data on area, crop rotation patterns (2005 to 2009, provided by the Ontario Ministry of Agriculture, Food and Rural Affairs), crops, tillage direction, tillage depth, tillage system, and manure. A shape file including fields and 161 farm houses was imported into the ABM. Soil types were identified from the Canadian soil survey report for the study area (MacNeil, 2010). MacNeil (2010) identified three major patterns in the conventional crop rotation data (Table 2).
The ABM model randomly assigns the conventional crop rotation pattern for each field in the first year of a 32-year period. Every time the program is initialized, the starting conventional rotation pattern, and for each field the current year within the rotation, will change. During 32 iterations (years) running the model, and based on decision rules, agents will decide, whether, to convert between conventional and organic crop rotations.
Organic crop rotations were classified into four patterns based on soil type, regional cropping histories and expert analysis of typical organic transition trajectories (MacNeil, 2010). Table 3 presents organic crop rotations, which were determined in consultation with experts at the Organic Agriculture Centre of Canada.
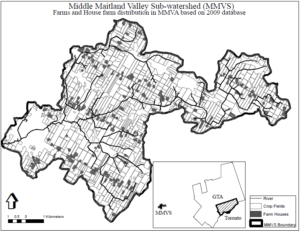
Figure 4- The Middle Maitland Valley Sub-Watershed, and it’s location with respect to Toronto and the Greater Toronto Area (GTA). (Fields and house distribution are based on 2009 data provided by the Maitland Valley Conservation Authority).
| Crop Pattern | First year | Second year | Third year | Predominant
Rotation (%) |
| 1 | Corn | Soybeans | Alfalfa | 59 |
| 2 | Corn | Soybeans | Winter Wheat | 56 |
| 3 | Corn | Soybeans | Corn | 44 |
Table 2- Conventional crop rotation patterns (MacNeil, 2010)
3. Economic and services data
A Budget Enterprise data base was prepared from templates provided by the Ontario Ministry of Agriculture, Food and Rural Affairs (OMAFRA) (http://www.omafra.gov.on.ca/english/crops/index.html). This data was used to calculate fixed costs, variable costs, yields and market prices (and hence net income) for both farming systems. A summary of the farm enterprise budget data base is presented in Table 4. Users may change any of the values in the farm enterprise budget.
| Rotation | Soil Type | Year 1 | Year 2 | Year 3 | Year 4 | Year 5 |
| R1 | Huron clay loam; Huron silt loam; Harriston silt loam; Burford loam | Corn | Soy | Spelt (under sown alfalfa/grass) | Alfalfa 1 | Alfalfa 2 |
| R2 | Huron clay loam; Huron silt loam; Perth clay loam; Perth silt loam; Listowel silt loam; Burford loam | Spelt (with Oil Radish cover) | Soy | Oats (under sown with clover/grass) | Hay | Hay |
| R3 | Huron clay loam; Huron silt loam; Burford loam; Perth clay silt loams; Listowel silt loam; Waterloo sandy loam | Alfalfa/Grass 1 | Alfalfa/Grass 2 | Alfalfa/Grass 3 | Alfalfa/Grass 4 | Oats/Barley or winter wheat |
| R4 | Brookston clay silt loams; Parkhill loam; Donnybrook sandy loam; Waterloo sandy loam; Bottom lands; Muck | Permanent pasture
|
- | - | - | - |
Table 3- Organic crop rotations (MacNeil, 2010)
| Yield
Variables |
Variable costs | Fixed costs | Revenues | ||
| Materials | Services | Others | |||
| Number of acres | Seed | Drying | Crop Insurance | Depreciation | Total Expected Revenues |
| Return per acre | Fertilizer | Storage, Bldg. Repair & Maint. | Program Premium | Interest on Term Loans | Expected Operating Margin |
| Yield per acre | Herbicide | Trucking, Mach. Repair & Maint. | Custom Work | Land Cost | Expected Net Revenue |
| Price per bu | - | Fuel | Interest on Operating Capital | Long-term leases | - |
| bu Production | - | Labor | - | - | - |
| Sub-Total for each category | |||||
| Total yield, cost and revenue | |||||
Table 4- A summary of EB data to calculate costs and net income for both conventional and organic farming systems