As described above, we developed a model that represents and operationalizes the key factors and relationships relevant to the context for decisions about agricultural transition that are indicated in the literature. However, depending on how one parametizes the model the system can be made to behave in a variety of ways, some of them unrealistic. For example, in our initial default setup we found that farm enterprise agents were more easily encouraged to convert from conventional to organic models than the literature and our own knowledge of the field would lead us to expect. As with any such model it needed to be calibrated so as to be reasonable approximation of system dynamics observed in reality and, where possible, verified by comparison of model outputs to expected values. (A further step, model validation, will need to be undertaken in the next phase of this project when the model is re-parameterized with data from a survey of farms in the MMVS).
Guided by literature about farmers’ attitudes and behaviour related to transition, we explored a variety of weights applied to 1) relative importance of farmer personal characteristics within the personal characteristics category, and 2) the relative weighting/importance of the personal characteristics category with respect to the exogenous factors (policy supports) category.
Table 7 presents eight weighting systems that we explored. Recall that in our simulation model farmer personal characteristics are assigned in each model specification for each characteristic randomly on a scale of 1-100. Weighting within the personal characteristics category was undertaken by adding or subtracting from the numbers assigned to each of the agents (while maintaining a floor of 0 and a ceiling of 100). For example, subtracting 25 from the value assigned to willingness to innovate skews the entire distribution of these values so that the mean value tends to be near “25” on a 100 point scale rather than tending to be near “50”. This loads the system with agents that could be described as “resistors” while removing keen adopters. Similarly, the overall weight assigned to the total impact of all personal characteristics was systematically modified to carry more and less weight in various weighting systems.
We applied the weighting in stages, with a few models with very different weights applied first, and used the results to narrow in on a weighting system that reflected the behaviour of such systems in the literature. We elected to use a couple of scenarios with levels of transition support and conversion responses similar to those reported in the literature for verification purposes. (With no supports at all none of the scenarios 52 scenarios we investigated demonstrated any degree of conversion).
| S4 | S23 | S24 | S25 | S26 | S27 | S28 | S47 | S48 | S49 | S50 | S51 | S52 | |
| Support for organic marketing infrastructure* | √ | √ | √ | √ | √ | √ | √ | √ | √ | √ | √ | √ | √ |
| Extension of transition advisory services* | √ | √ | √ | √ | √ | √ | √ | √ | √ | √ | √ | √ | √ |
| Access to information extension services* | √ | √ | √ | √ | √ | √ | √ | √ | √ | √ | √ | √ | √ |
| Subsidy for Transition (%) | 0 | 10 | 20 | 50 | 100 | 150 | 200 | 0 | 0 | 0 | 0 | 0 | 0 |
| Avoided Cost Payment-Amount ($) | 0 | 0 | 0 | 0 | 0 | 0 | 0 | 22.25 | 44.50 | 22.25 | 44.50 | 22.25 | 44.50 |
| Avoided Cost Payment-Duration (years) | 0 | 0 | 0 | 0 | 0 | 0 | 0 | 1 | 1 | 3 | 3 | 10 | 10 |
* Impact of number of services: No service available = 0, one service = 100, two services = 200, and three services = 300
Table 6- A summary of 13 of 52 scenarios in which agents changed farming systems (agents make a decision to convert from conventional to organic farming , Scenarios 4, 23, 24, 25, 26, 27, 28, 47, 48, 49, 50, 51, 52)
| Factors / Weighting | W1 | W2 | W3 | W4 | W5 | W6 | W7 | W8 |
| Internal factors (farm agent personal characteristics, points adjusted +/-) | ||||||||
| Personal conviction and attitudes toward environment and sustainability [SustValues] | 33 | -25 | 25 | -25 | 25 | -25 | 25 | -25 |
| Personal experience of negative effects of conventional farming [CF_Exper] | 33 | -25 | 25 | -25 | 25 | -25 | 25 | -25 |
| Willingness to innovate [RiskAver] | 33 | -25 | 25 | -25 | 25 | -25 | 25 | -25 |
| Financial difficulties [FDC] | - | - | 50 | -50 | - | - | - | - |
| Relative weighting of factor categories (%) | ||||||||
| Internal factors (Farm agent characteristics) | - | - | - | - | 50 | 50 | - | - |
| Exogenous factors (Services) | - | - | - | - | - | - | 50 | 50 |
Table 7- Some of the weighting scenarios investigated during model calibration.
Analysis of the 13 scenarios confirmed that weighting systems number three, four, six, and seven provided more viable results. Figures 5 and 6 show the visual comparison of the outcomes of weighting systems three and six for the twenty-third scenario. The number of organic farms increases more gradually over a period of 32 years when weighting system six was applied compared with weighting system three.
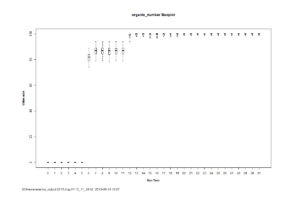
Figure 5- Visual comparison of the outcomes of third weighting system for the 23rd scenario
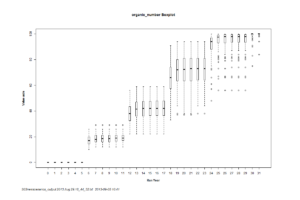
Figure 6- Visual comparison of the outcomes of weighting system six for the 23rd scenario